 jennie
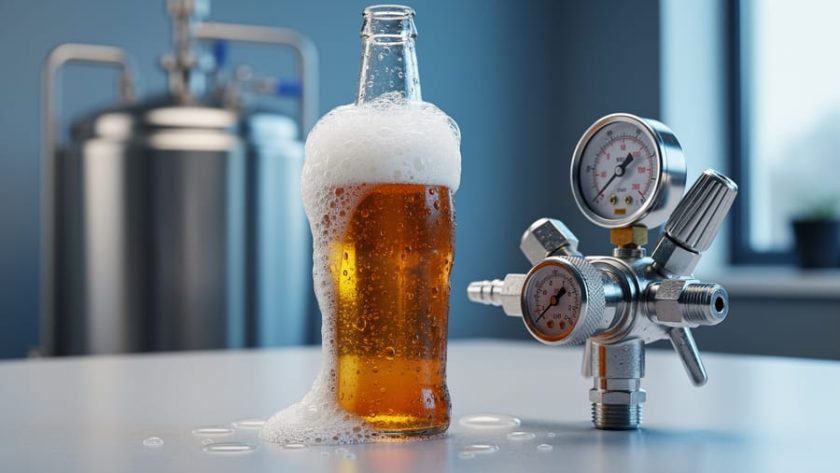
A carbonation beer chart is a reference table that tells you how much CO2 your beer needs and how to get it there. For kegging, it matches a target volume of CO2 to a pressure (PSI) at a given beer temperature. For bottling, it translates that same target into an amount of priming sugar per gallon. Either way, you pick your style, read across, and get a number you can use tonight.
The reason it works is simple physics. Cold beer holds more dissolved CO2 than warm beer, so the same 12 PSI that gives you a lively pale ale at 38°F will leave a beer at 50°F noticeably flat. A British mild sits near 1.5 to 2.0 volumes, while a hefeweizen can climb past 3.0. Guess wrong and you get flat pints or foam-fountain pours.
Here in Colorado, altitude adds a wrinkle. Gauge pressure reads differently at 5,280 feet than at sea level, and plenty of homebrewers along the Front Range have chased a “perfect” chart number that never quite delivered. This guide covers the main chart types for kegs and bottles, how to read them correctly, how to adjust for elevation, and how to fix it when your carbonation misses the mark.
What a Carbonation Beer Chart Means in Plain Terms
Why Carbonation Level Changes How a Beer Tastes and Feels
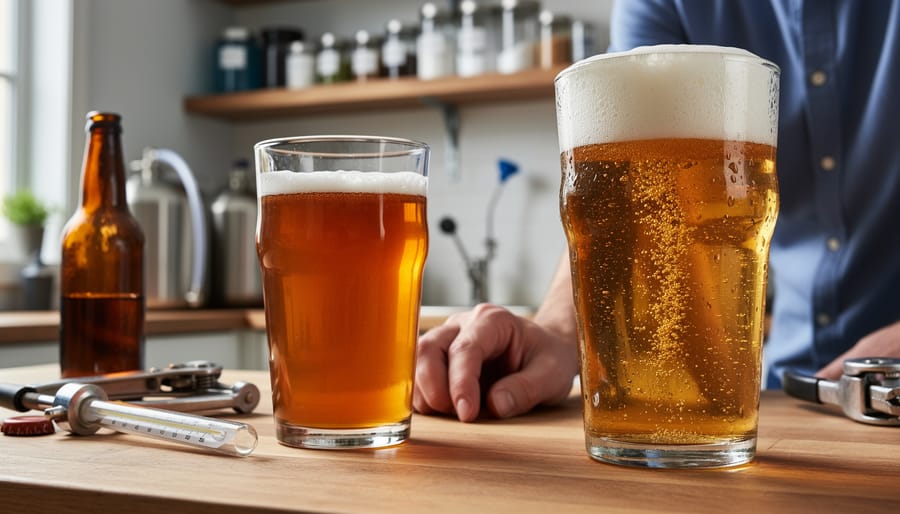
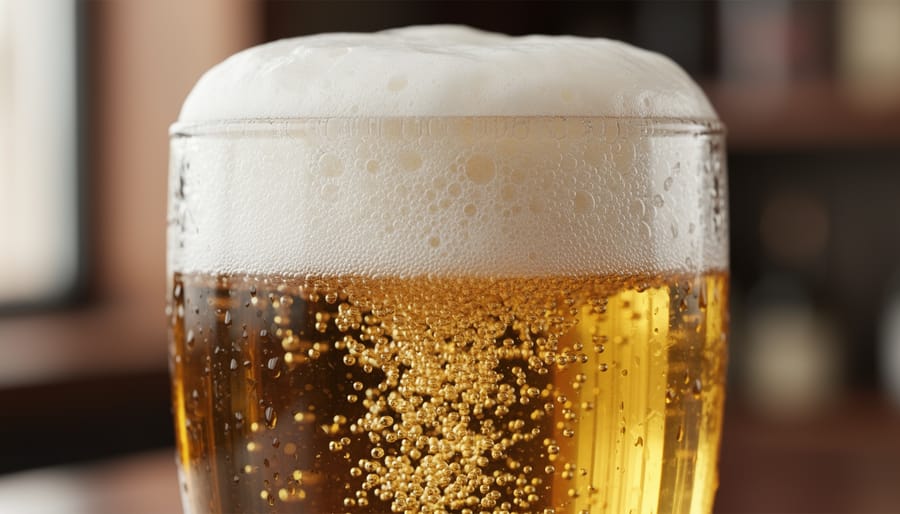
Carbonation does more than add bubbles. It shapes how a beer feels in your mouth, how it smells, and even how sweet or bitter it seems. That’s why craft beer carbonation deserves as much attention as your grain bill or hop schedule.
Start with mouthfeel. Higher CO2 gives a prickly, crisp bite that makes a pilsner or wheat beer feel light and refreshing. Lower levels leave a soft, rounded body, which is exactly what you want in a British bitter or a stout. Too much fizz on a malty beer can feel harsh, while too little on a lager makes it taste dull and heavy.
Aroma follows the same logic. Bubbles carry volatile compounds up to your nose as they burst, so a lively beer delivers more hop and yeast character. Perceived bitterness and sweetness shift too. Carbonic acid adds a slight sharpness that can sharpen bitterness and mute sweetness, so an overcarbonated beer often tastes thinner and drier than intended.
Finally, head retention. A well-carbonated pour builds a stable foam cap that traps aroma and looks inviting. Go too high and the beer gushes. Go too low and the head vanishes in seconds.
How Temperature, Pressure, and CO2 Volumes Work Together
Reading the Chart Step by Step
Start with the style you’re brewing, because the target volumes of CO2 drive every other number. A British bitter sits near 1.5 to 2.0 volumes, while a wheat beer might want 3.0 or more. Even a lively, tart beer benefits from this homework, since carbonation sharpens the sour beer taste you’re chasing.
Next, measure the temperature of the beer itself, not the air in your fridge. Stick a thermometer probe into a glass of water on the same shelf, or tape one to the keg, and give it time to settle.
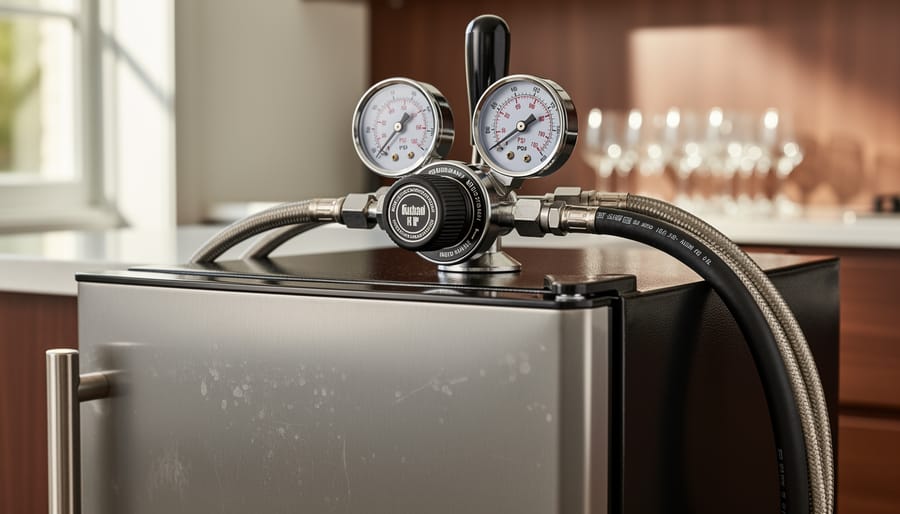
Now find where your target volumes and your beer temperature meet on the chart. That intersection is your PSI. Set your regulator to that number and open the gas.
Then wait. Gas dissolves slowly, so give it a few days at a steady temperature, and check your pour before you celebrate.
Why Colorado Brewers Need to Think About Altitude
Most carbonation charts list PSI as gauge pressure, which is the reading on your regulator. Your gauge measures pressure above whatever the air around it is doing. At sea level, the atmosphere adds about 14.7 PSI on top of that reading. In Denver, at roughly 5,280 feet, the atmosphere only pushes about 12.2 PSI.
Here’s why that matters. Dissolved CO2 responds to absolute pressure, which is gauge plus atmospheric. Set the same 12 PSI on your regulator in Denver as you would in Houston, and your beer sees about 2.5 PSI less total pressure. That means a bit less CO2 in solution, so a beer dialed to a sea-level chart can finish slightly flat.
If you’re brewing along the Front Range or up in the mountains, a few practical fixes help:
– Add roughly 0.5 PSI to your regulator setting for every 1,000 feet of elevation as a starting point.
– Nudge up in small steps, then taste and adjust rather than jumping several PSI at once.
– Keep notes on each batch so you learn your own home’s sweet spot.
Rather than trusting a printed table blindly, plug your temperature, target volumes, and elevation into a carbonation calculator that accounts for altitude. Think of the chart as the map and the calculator as the GPS that knows you live a mile up.
Types of Carbonation Charts for Kegs and Bottles
Force Carbonation Charts for Kegging
A force carbonation chart is the one you’ll reach for most when kegging. It lists regulator pressure down one side and beer temperature across the top, and the cell where they meet tells you the CO2 volumes you’ll end up with at equilibrium.
The set-and-forget method is the simplest way to use it. Chill the keg, find your target volumes, set the regulator to the matching PSI, and leave it alone for a week or so. Because the gas pressure can’t push the beer past the number on the chart, it’s very forgiving. Beginners love it for that reason.
The faster burst approach cranks the regulator well above the chart number for a day or two, then drops it back to serving pressure. It saves time, but it’s easier to mess up. Overshoot and you’re stuck with a foamy, overcarbonated keg that needs venting and patience to fix. If you go this route, taste early and check often.
Priming Sugar Charts for Bottle Conditioning
A priming sugar chart answers one question: how much sugar do you add to your bottling bucket to hit a target CO2 level? The numbers hinge on three inputs. Batch size sets the total sugar. Beer temperature at bottling matters because a beer that sat warm during fermentation has already shed some CO2, while a cold-crashed beer still holds more. Together, those give you the residual CO2 the chart subtracts from your target.
The sugar you use changes the weight you need, since each one ferments out differently:
- Corn sugar (dextrose) is the standard baseline, about 91% fermentable and clean tasting.
- Cane or table sugar is a bit stronger, so you use roughly 10% less by weight.
- Dry malt extract is only about 80% fermentable, so you need around 30% more and get a slightly fuller feel.
- Honey ferments out dry and can leave subtle flavor, but its water content makes the dosage less predictable.
Weigh your sugar on a scale rather than measuring by volume, because a cup of table sugar and a cup of corn sugar weigh different amounts. Dissolve it in a little boiled water, mix it gently into the beer, and bottle. Then give it two weeks at room temperature.
Style-Based CO2 Target Charts
Before you touch a pressure chart or measure out priming sugar, you need a destination. Style-based charts give you that target, expressed in volumes of CO2, so every other number has something to aim at.
The ranges are fairly intuitive once you see them side by side:
– British-style ales and stouts: roughly 1.5 to 2.2 volumes. These beers are meant to taste smooth and soft, closer to a cask pour than a sparkling one.
– American ales, pale ales, and IPAs: about 2.2 to 2.7 volumes, enough lift to carry hop aroma without scrubbing the palate.
– Lagers and pilsners: around 2.4 to 2.8 volumes for a crisp, clean snap.
– Wheat beers and Belgian ales: often 2.8 to 4.0 volumes, with some Belgian styles going higher still. That lively, almost champagne-like fizz is part of the identity.
Treat these as starting points, not laws. Guidelines vary slightly between sources, and your own taste counts. Pick your style, note the middle of its range, and carry that number into the force carbonation or priming sugar chart you plan to use.
How Homebrewers Put a Carbonation Chart to Work
A Local Brewer’s Take on Dialing In Carbonation
This is a spot we’re saving for a real Colorado brewer’s voice. The plan is to sit down with a homebrewer or small-batch brewer from the Front Range or the high country and ask a few simple questions. Which chart do you keep taped inside the fermentation fridge? What mistake taught you the most? And what’s the one tip you’d hand a first-timer?
Until that conversation is sourced and approved, here’s the kind of ground we want it to cover. A brewer who works with fruit sour brewing deals with a different carbonation puzzle than someone pouring a crisp lager, because leftover sugars and active cultures can keep making CO2 long after bottling. The same goes for anyone bottling a dark sour beer where a patient approach to priming matters even more.
Expect the brewer to talk about how they match the chart to the beer, how altitude changes their numbers, and how they log every batch so the next one is easier. We’ll add their words here once we have them, along with their name and permission to share.
Common Questions About Carbonation Beer Charts
How many volumes of CO2 does an IPA need?
Most IPAs land around 2.2 to 2.6 volumes, which keeps hop aroma lively without a harsh, prickly bite. Check your style chart, then nudge a few tenths either way to match your taste.
Can I use the same chart for nitro beer?
No. Nitro beers use a nitrogen or nitrogen/CO2 blend at much higher serving pressure, so a standard CO2 pressure-by-temperature chart will steer you wrong.
Why is my keg still flat after a week at the charted PSI?
The usual culprits are a fridge that’s warmer than you think, a leaky keg lid or fitting, or simply not enough time to reach equilibrium. Test every seal with a bit of sprayed sanitizer, confirm the beer’s true temperature, and give a set-and-forget keg a full two weeks.
Do I need to adjust for altitude?
Yes, if your gauge reads pressure relative to the air around it, as most do. At Colorado elevations the real pressure inside the keg is a bit lower than the chart assumes, so a small bump in PSI, or a quick check with an online calculator, helps you hit your target.
Printed charts and online calculators use the same underlying gas-solubility math, so accuracy rarely differs much. The calculators win on convenience because they can factor in altitude, batch size, and sugar type for you. Printed charts are great taped inside the keezer door, where you can read them with a cold beer in hand.
Already kegged without a plan? You can still fix it. Chill the beer, hook up CO2, and use the chart to set your pressure, then wait it out. If you’re after something lighter on the alcohol side, the same carbonation principles apply to N/A craft beer where fizz level matters just as much for mouthfeel and flavor.
At the end of the day, a carbonation chart is just a lookup tool. It takes the guesswork out of fizz and gives you numbers you can repeat, whether you’re force carbonating a keg or priming a case of bottles. Once you see that, it stops feeling like science homework and starts feeling like a trusty brewing buddy.
So pick one method, bookmark a chart you trust, and jot down your numbers every time you carbonate. A few batches in, you’ll have your own dialed-in playbook. We’d love to hear how it goes, so swing by and share your results or your favorite carbonation tips with the Brewing Specifics community. Cheers, and happy brewing!